First things first, Newcastle City Council plans to close down 10 libraries across the city as part of a wider series of budget cuts. This represents the closure of more than half of all existing branches and will cause considerable harm, apart from being just silly.
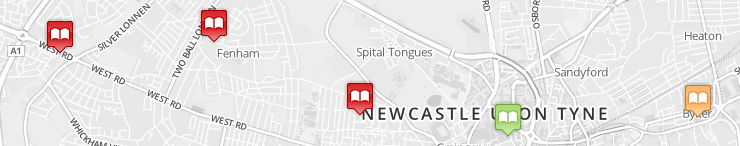
If you are concerned about it, head to SaveNewcastleLibraries.org to find ways to get involved, or click on the image below to open a map showing the location of the planned closures, as well as the contact details for their local councillors.
The rest of this post explains the story behind the data used to build this map.
A call for action
A while ago I learnt about the mentioned plans that Newcastle City Council had for the local libraries via one of its tweets. Closing libraries is not a nice thing to do, so I was immediately curious about the extent of the proposal: would my local branch be affected?, how many branches across the city would close?
Buried deep beneath the linked survey website there was a link to a document with the Library Network Reduction Proposal (pdf, 115 Kb), which you have to trawl to actually get the names of the affected libraries. These turned out to be 10 out of 18 existing branches, some of which I didn’t know where were located, so my immediate reaction was to create a map with them. What if I also added the contact details from the local councillors for each branch so people could raise their concerns more easily?
That was it then, get the libraries locations and local councillors, a bit of processing to add the planned status to each library, put together a nice Leaflet / Mapbox combo and we are all set, right? Right?
Sadly it was not going to be that easy.
Looking for available data
The first port of call for spatial developers looking for free and open geodata is probably OpenStreetMap. Unfortunately, the library POIs for Newcastle on OSM were incomplete and included libraries which didn’t belong to the Council, so that wasn’t going to be an option.
Contrary to their Sunderland neighbours, the Newcastle City Council website does not have a public downloads page with Open Data datasets (In this sense, mackems are well ahead of geordies). The closest I found was a page with a Bing map showing libraries locations. It looked like it would be scrapping after all.
Now, a list of councillors and their email addressesses should be easy to find on any Council web site. Newcastle City Council one indeed has a list of all councillors with their contact details, even comma separated! The fact that the list is printed on the page and not on a separate linked CSV file would be only mildly irritating if it wasn’t for the fact that this list does not show which ward the councillors belong to, which is a quite important piece of information to miss.
The only way of getting the ward a coucillor belongs to is via a web form, so this one also looked like it was going to be copy & paste.
Structured data is born
Michelangelo is quoted as saying that inside every block of marble there was a statue awaiting to be freed. Similarly, inside every dodgy web page from an organization there is a nice clean dataset awaiting to be created.
In these first stages, data wranglers need to get their hands dirty, copy and pasting or scrapping data into their favourite editors, doing some regexp wizardry and manually editing the data. The result is a file that can be used by a computer program to display its contents, transform its format, combine it with other files, etc.
In my case, I ended up with the libraries names and locations (plus plans according to the reduction proposal) in CSV and GeoJSON format, which is very convenient for mapping applications.
#libraries.csv
name,plan,due,longitude,latitude
"Moorside Library",close,"June 2013",-1.635681,54.976958
"Kenton Library",keep,,-1.653120,55.005594
[...]

#libraries.geojson
{"type":"FeatureCollection",
"features":[
{"type":"Feature","properties":{"name":"Moorside Library","plan":"close","due":"June2013"},"geometry":{"type":"Point","coordinates":[-1.635681,54.976958]}},
{"type":"Feature","properties":{"name":"Kenton Library","plan":"keep","due":""},"geometry":{"type":"Point","coordinates":[-1.653120,55.005594]}},
//[...]
On the other side, thanks to the Coucil website, I had two different CSV for the councillors, one with the contact details of each councillor and another with their ward and party.
So what needed to be done was:
- Find out on which ward was located each library.
- Merge the two councillors files to have a single file with the ward and email of each councillor.
- Assign the relevant councillors to each library depending on the ward they were located.
To which ward belongs library X?
The basic operation that we need to perform is knowing the location of a point (a library), extract an attribute from a polygon layer that contains it (a ward). People familiar with GIS will probably think about doing a spatial join, but in my case I didn’t have the wards polygon layer, and if there is a suitable API available there is a quicker way if you don’t mind putting together a quick script.
This API is the excellent MapIt by MySociety. It basically returns administrative areas for any given point or postcode (in the UK) which is exactly what we need here. A request looks like this one, note the latitude and longitude at the end:
http://mapit.mysociety.org/point/4326/-1.635681,54.976958
This Python script reads the libraries GeoJSON file, loops through each library and queries the MapIt API for its coordinates, storing the result back in a new GeoJSON file:
import json
import requests
query_by_point_url = 'http://mapit.mysociety.org/point/4326/{lon},{lat}'
with open('libraries.geojson', 'r') as f:
libraries = json.loads(f.read())
for library in libraries['features']:
url = query_by_point_url.format(
lon=library['geometry']['coordinates'][0],
lat=library['geometry']['coordinates'][1]
)
areas = requests.get(url).json
for key, area in areas.iteritems():
if area['type'] == 'MTW': # We want Metropolitan district wards
library['properties']['ward_id'] = key
library['properties']['ward_name'] = area['name']
break
with open('libraries_with_wards.geojson', 'w') as f:
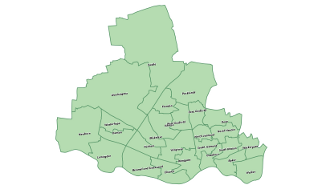
f.write(json.dumps(libraries))As a small aside, it is worth mentioning that the MapIt API is also a great way of obtaining the geometries of administrative areas, which are already returned as GeoJSON. For instance, this script will get all ward geometries for Newcastle, but it should be trivial to adapt to any other area.
Cleaning up and merging CSV files
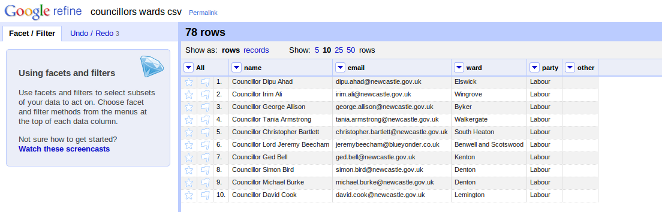
For cleaning and working with CSV files or spreadsheets, OpenRefine (The Software Formerly Known As Google Refine) is extremely useful. It is definitely very recommended for anyone looking for a good tool for working with data, and there are several good resources across the web to help you getting started.
OpenRefine allows you to perform basic cleaning up operations, for instance:
- Finding blank cells (Select column menu > Facet > Customized facets > Facet by blank)
- Trim spaces (Select column menu > Edit cells > Common transforms > Trim leading and trailing whitespace)
But it also supports more advanced stuff, like importing a column from another file which can be joined by a common column. In my case, I needed to import the “Email” column from the contact details file into the one that had the ward names, and the common column was the councillor name.
- Load both files into OpenRefine (in my case “councillors wards csv” and “councillors address csv”
- On the wards one, on the column “name” > Edit column > Add column based on this column…
- The [cross](http://code.google.com/p/google-refine/wiki/GRELOtherFunctions#cross(cell_c,_string_projectName,_string_columnName)
function needs to be used:
cell.cross("councillors address csv","Name").cells["Email"].value[0]
Done. The resulting file can be exported again as CSV using the option on the top right side of the page.
Joining libraries and councillors via wards
Once the libraries and councillors datasets were ready, they only needed to be joined via the common field, the ward name. I used another small Python script for this:
    import csv
    import json

    with open('libraries_with_wards.geojson', 'r') as f:
        libraries = json.loads(f.read())

    councillors = []
    with open('councillors-emails.csv', 'r') as f:
        reader = csv.DictReader(f)
        for row in reader:
            councillors.append(row)

    def get_councillors(ward_name):
        found = []
        for councillor in councillors:
            if ward_name == councillor['ward']:
                found.append(councillor)
        return found

    for library in libraries['features']:

        library['properties']['councillors'] = get_councillors(library['properties']['ward_name'])

    with open('libraries_with_councillors.geojson', 'w') as f:
        f.write(json.dumps(libraries))
The end result was a GeoJSON file which, apart from the location information, contained data about the ward and the councillors for each library, just what was needed for the web map.
Of course, there are many ways in which a dataset like this one could have been produced, for example using only Python scripts or libraries like pandas, or doing the whole process in OpenRefine. (also, given enough time, there is always the hard way of copying and pasting things on a spreadsheet).
Telling a story with data
Developers used to work with data may find some pleasure in nice and cleaned up datasets per se, but most people won’t share our excitement at the sight of a CSV file or a JSON API. Data needs to visualized and used in a way that gives meaning to it.
A list of library names in a PDF does not tell you much. Even a list of libraries and the plans for them in a spreadsheet is not likely to have a big impact on you. But map these libraries across the city, clearly flagging the proposed closures, and the scale of the proposal starts becoming apparent. Put the contact details of the local councillors that represent you just one click away from the library that is meant to be closed and maybe people would find easier to raise their concerns.
This is one of the promises and goals of Open Data. Make easier for data to find its way to citizens and have an impact on their lives.
Visit the Proposed Library Closures map here: http://amercader.github.com/savenewcastlelibraries/
All datasets and scripts mentioned on this post are available on GitHub and the DataHub: