After a long day in front of your laptop or just to think of a fresh approach to that annoying bug, what’s better than going for a run?
There are amazing examples out there of the kind of stuff you can do with your running data, and more and more readily available data visualization tools open a lot of possibilities.
To make easier to get started hacking with your running data to those of you who use RunKeeper (and to celebrate PostGIS day!), here is a small script that will import your data into PostGIS.
Getting the data
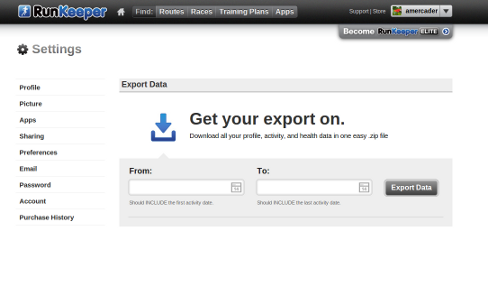
One thing I like about RunKeeper is that it does not lock your data and makes really easy to download it. Just head to the export data page and select the date range you prefer.

This will generate a zip file which contains two CSV files and as many GPX files as activities you have. The cardioActivities.csv file contains information about each run, such as date, total distance, average pace, etc., and crucially, the name of the GPX file which contains the track of the run. Our aim is to get this file exported as a table with all the data fields and a geometry column that contains the actual spatial data.
Running the script
You will obviously need PostgreSQL and PostGIS installed, and we are also going to use ogr2ogr to import the geometries.
Extract the zip file and cd into it. Download the following script and tweak the configuration paramters to suit your needs (You may need to change the way psql is called depending on your Postgres authorization setup).
What next?
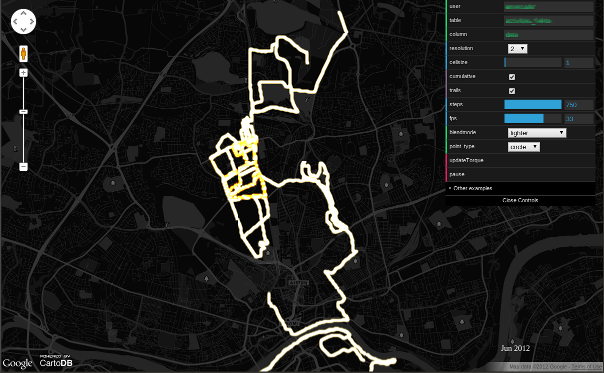
Once you have a nice structured table on PostGIS it can be easily loaded into a number of tools like TileMill or QGIS. One quick way of having a nice temporal visualization of your runs is using Torque, a library powered by CartoDB. If you upload your data to CartoDB you just have to enter your user name and table name to get a visualization of your runs.

Here are some quick steps on how to get it working:
-
Export your data to one of the formats supported by CartoDB. Here I’m using GeoJSON:
ogr2ogr -f GeoJSON activities.geojson PG:"dbname='db_test' host='localhost' port='5432' user='XXXXXX' password='YYYYYY'" TABLE_NAMEImportant: for some reason the GeoJSON import only works on CartoDB if the file is zipped, so create a zip of your file.
-
Create an account on CartoDB if you don’t already have one, sign in and select “Create a new table”.
-
Select “I want to start with some imported data” and pick the zipped GeoJSON file.
-
If all went right, you should see your records on a table. Select “Change data type” on the date field header and choose Date.
-
Head to http://cartodb.github.com/torque, enter your user name and table name on the top right boxes and click on “Update Torque”. That’s it! You can play around with the controls to change the visualization.
Hopefully this gets you inspired to play with your own data and do some nice visualizations or hacks!